
Flagship · App Store
Aegis BI
AI Financial Intelligence
AI-assisted financial intelligence that stays current: connect OneDrive or Google Sheets, then read the numbers anywhere through command-center dashboards, forecasting, what-if scenarios, and the Glaukos AI analyst.

- $50/mo · $500/yr
- iPhone · iPad · Mac · Web
- Python · Dash (Plotly)
- Docker on EC2
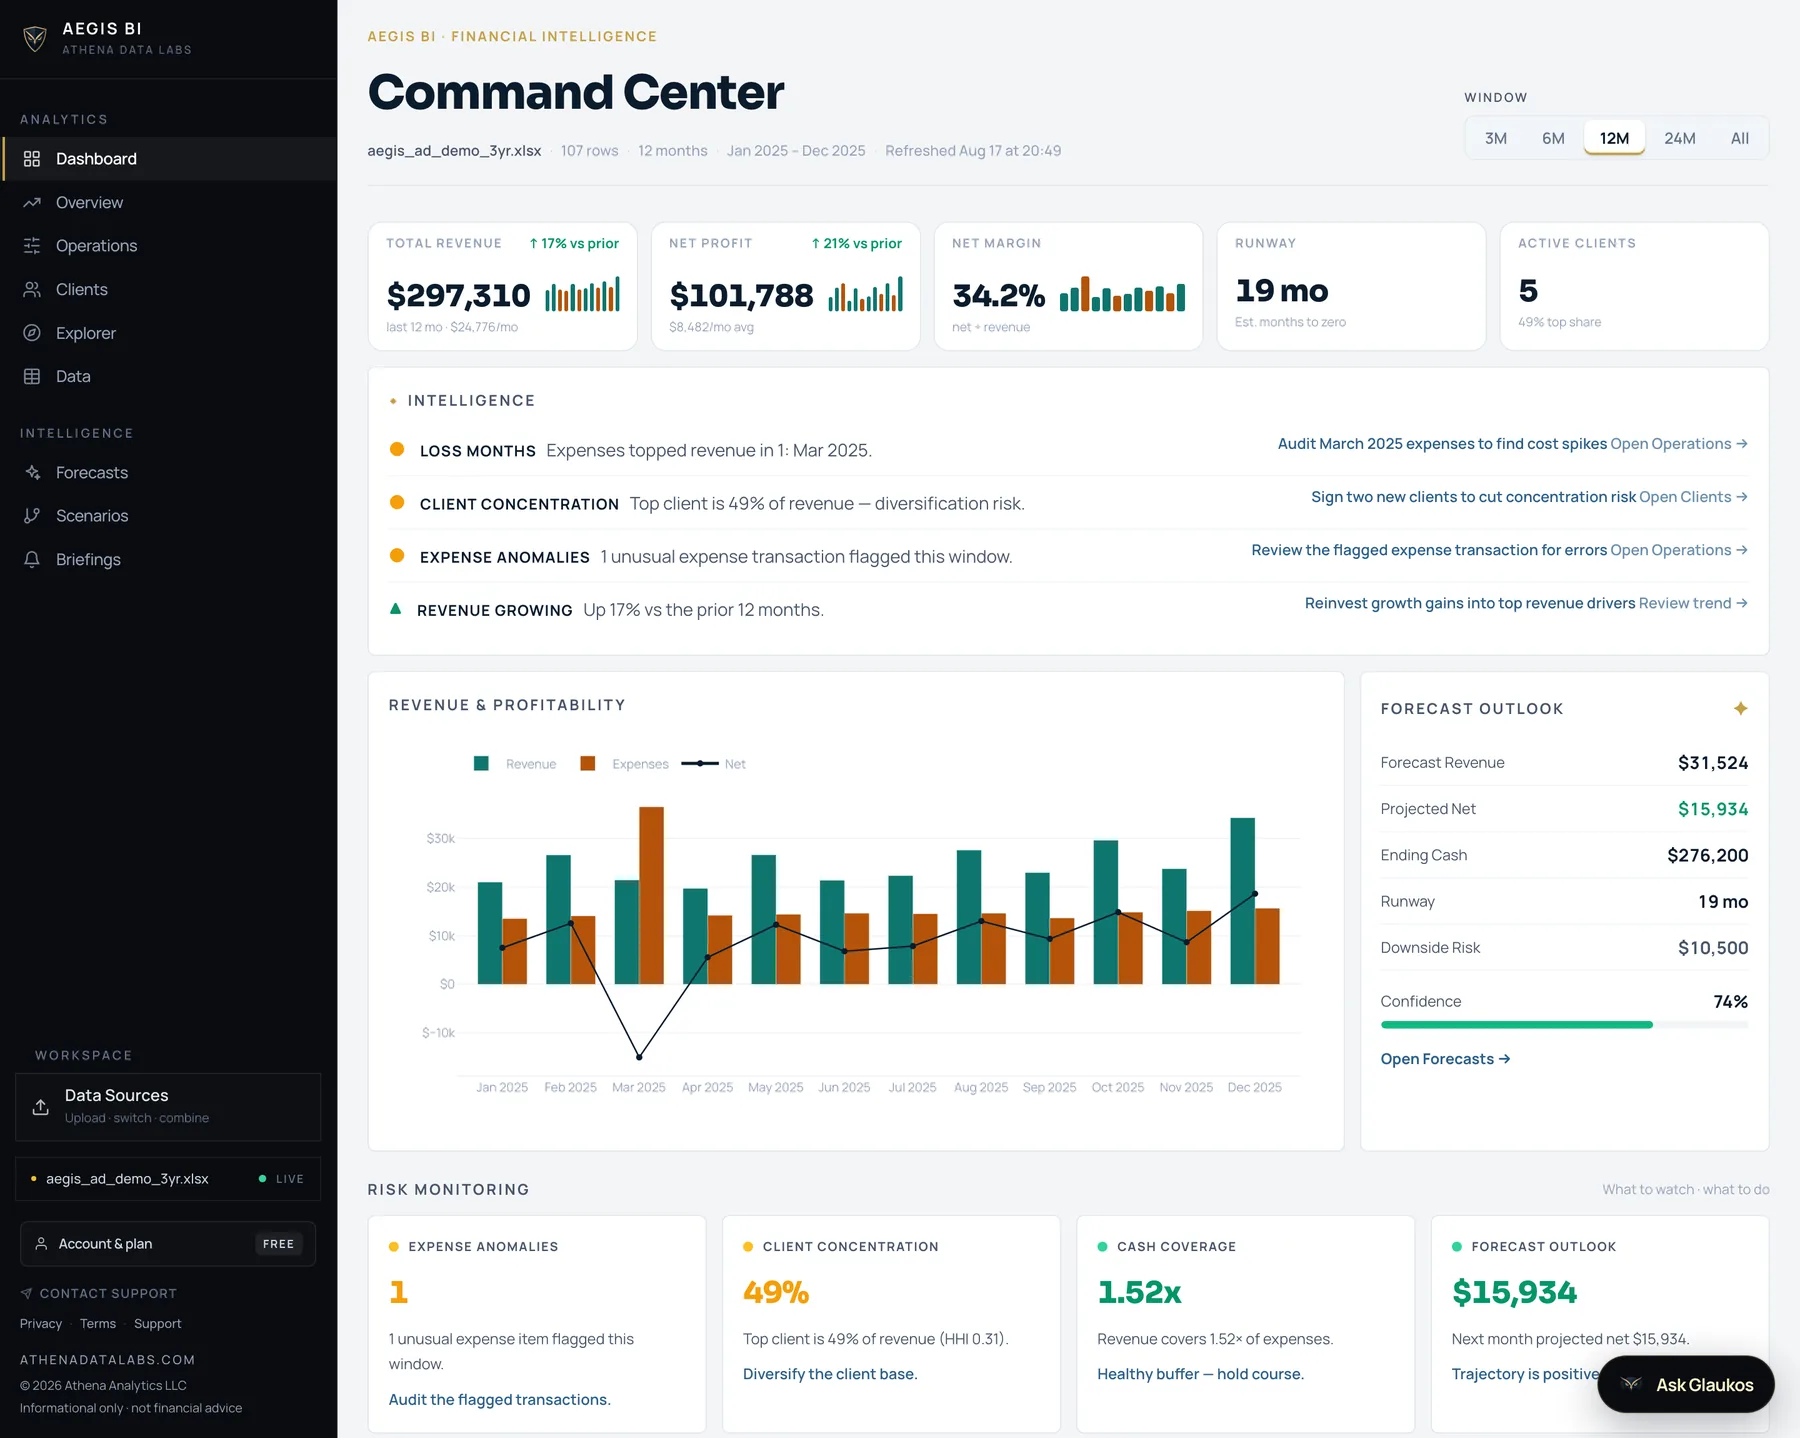
Aegis BI is our flagship business-intelligence platform, now live in production on the web and on the App Store. Point it at the numbers you already keep: upload a workbook, or connect OneDrive or Google Sheets so the dashboard moves when the source file does. Aegis maps the columns, builds a command-center dashboard, forecasts cash and revenue, runs what-if scenarios, and answers questions in plain English through Glaukos, its built-in AI analyst.
It runs on a phone and a Mac as well as in a browser, and that is not a checkbox. The decisions it informs are rarely made at a desk. A founder in a meeting, an operator on a site visit, a partner waiting at an airport: all three need the same current numbers. They should be able to answer the question in front of them rather than promise to look it up when they get back.
It is built to run as a company's primary BI system, from board reporting to daily operations, without a data team to stand it up. Privacy-first by architecture: uploaded data stays in your browser, and the backend is a stateless calculator that stores nothing.
Spreadsheet in, dashboard out
A 13-column workbook with headers like Flow, Txn Amt (USD) and FX Adj. Glaukos reads every column, proposes a role for each with its confidence, flags the two worth a second look, then builds the dashboard once you confirm.
The tabs that come free
Command Center with revenue, margin and runway, then client concentration, an expense anomaly timeline with the outliers marked, and an Explorer for the view no fixed tab has.
Ask for a chart nobody built
“Show me a graph of monthly revenue from Meridian Health only.” Glaukos draws it inline, and volunteers what the number means: that one client is 48.9% of the book.

Glaukos · AI Analyst
Ask your data in plain English
Glaukos reads your live dashboard context, runs risk-first analysis, and returns actionable recommendations and briefings. No SQL, no formulas.
Input
Operational metrics, financial trends, and customer signals unified into one workspace.
Insight
Forecasts, anomaly detection, and agent-generated narratives that explain what changed.
Outcome
Faster, higher-confidence decisions with transparent context and prioritized next actions.
Small and mid-sized businesses run on spreadsheets: the numbers exist, but there's no live picture of cash, revenue trajectory, or risk. Traditional BI platforms assume a data warehouse and an analyst team most companies don't have.
Aegis closes that gap without a pipeline project. It reads the files you already keep, and if those files live in OneDrive or Google Sheets it keeps reading them, so the dashboard is current instead of correct-as-of-last-Tuesday.
The second gap is where the answer reaches you. A report that only opens on the office desktop is a report you cannot use in the room where the decision happens, which is why Aegis ships as a native app on iPhone, iPad and Mac alongside the browser version.
What It Does
- 01
Command-Center Dashboard
Live KPIs (revenue, expenses, net, coverage, margin, runway) with trend context and targets.
- 02
Cash & Revenue Forecasting
Forward-looking projections with honest uncertainty, retrained as new data arrives.
- 03
What-If Scenarios
Model hiring, pricing, and spend decisions and see the downstream impact instantly.
- 04
Signal Alerts
Expense anomalies, client concentration, and risk flags surfaced automatically.
- 05
Glaukos · AI Analyst
Ask your data in plain English. Risk-first analysis, briefings, and recommendations with visible reasoning.
- 06
Spreadsheet-Native Onboarding
Upload a workbook; Aegis maps columns and builds the dashboard. No ETL project required.
- 07
OneDrive & Google Sheets
Connect the file where it already lives and the dashboard follows it, so the numbers are current without a re-upload.
- 08
On the App Store
A native app on iPhone, iPad and Mac, so the command center comes into the meeting, the site visit, or the airport lounge.
Priced in the Open
$50/mo$500/yr
$50 per month, or $500 per year (two months free). Live in production, with guided onboarding and an executive demo available before you commit.
Talk to Us About Aegis BIDocker on EC2, in its own AWS account
Every product runs in a separate account under one AWS organization, so a mistake in one has nothing to reach in another.
- Python
- Dash (Plotly)
- FastAPI
- Pandas
- OpenAI API
- OneDrive API
- Google Sheets API
- IndexedDB · On-Device
- Docker
- AWS EC2
Common Questions
Related Reading & Services
Aegis BI: Building an AI Financial Command Center for Small Business
How we designed and built a BI platform that reads the files a business already keeps, forecasts from them, and travels in a pocket, now live in production.
4 min read
The Power of Privacy: How Ephemeral Backends Make Our Products Harder to Breach
You can't leak what you never stored. How one architectural decision, backends that hold as little user data as possible for as short a time as possible, runs through Aegis BI, MyBudgetNerd, and Thera, and why it's a security strategy, not just a privacy stance.
10 min read
Designing Executive Dashboards People Actually Use
Most dashboards are chart collections nobody opens twice. Decision-first design builds around operating questions and treats alerts as the product.
2 min read
AI Agents with a Human in the Loop: Trustworthy Automation
The AI agents that survive real operations share one principle: they recommend, humans decide. How we build agents that earn trust rather than demand it.
2 min read
Ready to Deliver Your Next Data Product?
Share your goals by email and we will respond with a practical next-step plan for scope, timeline, and delivery.



© 2026 Athena Data Labs
A division of Athena Analytics L.L.C.